
Why food security starts below your feet — and why “rural” does not automatically mean “fertile”
If water is the foundation of survival, soil is the foundation of food. Yet soil is one of the most misunderstood aspects of preparedness and homesteading. Many people assume that moving to the countryside automatically means good growing conditions. In reality, some of the most challenging soils in North America are rural, remote, and deceptively green.
Soil and agricultural maps exist because land does not behave uniformly. Two properties separated by a single road can have dramatically different soil profiles, drainage behavior, and long-term productivity. For preppers and homesteaders, these differences determine whether food production is sustainable — or a constant uphill battle.
Soil maps replace guesswork with realism. They show what land can support, what it resists, and what kind of effort it demands over time.
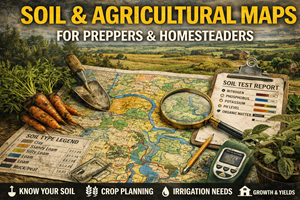
What soil & agricultural maps actually show
Soil and agricultural maps typically include:
- soil types and classifications
- drainage characteristics
- texture (sand, silt, clay, loam)
- organic matter content
- depth to bedrock or restrictive layers
- erosion risk
- suitability for crops, pasture, or woodland
Unlike satellite imagery or casual observation, soil maps are based on physical sampling, long-term observation, and agricultural performance. They describe how land behaves, not just how it looks.
In practical terms, soil maps answer questions like:
- Will this land hold water or shed it?
- How hard will it be to grow food here?
- What amendments are realistic vs unrealistic?
- Will machinery sink, compact, or struggle?
- How resilient is this soil under stress?
Why soil maps matter for preparedness
1) Food production is limited by soil, not intention
Motivation does not change soil chemistry. Effort does not override drainage problems. And good intentions don’t fix shallow, rocky, or compacted soils quickly.
Soil maps help you understand:
- what crops are realistic
- what growing methods are required (raised beds, hugelkultur, containers)
- how much labor and input is needed
- what will fail repeatedly
Preparedness is about working within constraints, not pretending they don’t exist.
2) Poor soil amplifies stress during disruptions
In stable times, poor soil can be compensated for with:
- fertilizers
- imported compost
- irrigation
- equipment
During disruptions, those inputs may be unavailable or expensive. Soil that requires constant inputs is fragile under stress.
Soil maps help identify land that:
- produces with fewer inputs
- recovers faster after drought or flooding
- resists erosion
- supports multiple food strategies
3) Soil influences water more than people realize
Soil and water are inseparable. Soil maps reveal:
- how fast water infiltrates
- how long moisture is retained
- where runoff accelerates
- where waterlogging occurs
These factors affect:
- garden success
- livestock health
- road stability
- building foundations
Ignoring soil-water interaction leads to repeated failures.
Why soil maps are essential for homesteaders
Homesteaders live with soil every day. Soil maps support:
- site selection
- garden and orchard placement
- pasture management
- erosion control
- long-term fertility planning
They also prevent costly mistakes, such as:
- planting orchards in poorly drained soils
- building on expansive clays
- grazing livestock on erosion-prone slopes
- relying on land that cannot sustain production
Good soil doesn’t eliminate work — but it rewards it.
Understanding basic soil limitations (the big ones)
Drainage
Poorly drained soils:
- suffocate plant roots
- delay planting
- increase disease
- complicate access
Well-drained soils:
- support healthier roots
- allow flexible planting
- reduce disease pressure
Soil maps often classify drainage explicitly — learn to read it.
Texture (sand, silt, clay)
- Sandy soils: drain fast, low nutrient retention
- Clay soils: hold nutrients but drain poorly, compact easily
- Loams: balanced, ideal for most crops
Texture determines how forgiving your land will be when conditions aren’t ideal.
Depth & restrictive layers
Some soils look fine until you dig — then hit:
- bedrock
- hardpan
- dense clay layers
These restrict roots, water movement, and long-term productivity. Soil maps often identify these limitations.
Agricultural suitability vs “can it grow something?”
Many soil maps include land capability ratings — how suitable land is for sustained agriculture.
Important distinction:
- Can something grow here? → short-term success
- Can this land support production year after year? → long-term resilience
Preparedness favors land that produces reliably, not land that works only with constant intervention.
Real-world prepper use cases for soil maps
Evaluating survive-off-the-land regions
Your site’s “best places to survive off the land” maps gain depth when users understand soil context:
- forage abundance often correlates with soil health
- wildlife density follows soil productivity
- edible plant diversity depends on soil quality
Soil maps help explain why certain regions support life more easily.
Planning food redundancy
Soil maps allow diversified strategies:
- gardens in better soils
- livestock where pasture soils allow
- perennial crops where drainage and depth permit
- wild forage where soil supports diversity
Preparedness improves when food sources aren’t all dependent on one fragile system.
Avoiding false confidence
Some regions look lush but rely heavily on irrigation, imported nutrients, or fragile soil structures. Soil maps reveal this dependence before it becomes a problem.
Where to find soil & agricultural maps (real sources)
United States
- USDA NRCS Web Soil Survey — the gold standard for U.S. soil data.
https://websoilsurvey.nrcs.usda.gov/
This tool allows you to:
- define an area of interest
- view soil types
- generate reports on limitations, crops, drainage, and capability
Canada
- Canadian Soil Information Service (CanSIS) — national soil data and maps.
https://sis.agr.gc.ca/cansis/ - Provincial agricultural and land-resource portals (often more detailed locally).
(Tip: local agricultural extensions often interpret soil data more practically than raw maps.)
Offline strategy for soil maps
What to keep printed
- soil map for your property or target region
- soil capability ratings
- drainage and depth notes
What to annotate
- areas needing raised beds
- erosion-prone zones
- best pasture areas
- places where machinery struggles
Soil changes slowly, but your understanding should improve over time.
Practice drills that build soil literacy
Drill A: “Map vs shovel”
Compare soil map predictions with actual digging. Note where they align — and where they don’t.
Drill B: “Rain test”
Observe how water behaves after heavy rain. Match patterns to soil drainage classes.
Drill C: “Crop reality check”
List crops you want to grow, then verify soil suitability honestly.
Common mistakes with soil maps
- Mistake: assuming rural land equals good soil
Fix: always check soil data. - Mistake: believing amendments solve everything
Fix: amendments help, but they don’t change structure quickly. - Mistake: ignoring erosion risk
Fix: erosion is cumulative and permanent. - Mistake: planning food without soil diversity
Fix: diversify growing methods and locations.
How soil maps connect to your Prepper Map Packs
Your curated maps for:
- best places to live
- survive-off-the-land regions
- foraging zones
…all depend on soil reality.
Soil maps are the ground-truth layer that explains long-term sustainability.
This fits cleanly into the series message:
“Preparedness isn’t just about access to land — it’s about land that can keep feeding you when inputs disappear.”